|
Kindergartners, we are talking all about graphing in the fourth quarter! What's a graph you ask? Well, look below, and you'll see a picture graph I made about favorite ice cream flavors. I asked 20 Tritt teachers if they liked chocolate, vanilla, or bubblegum. Here's what I found out:
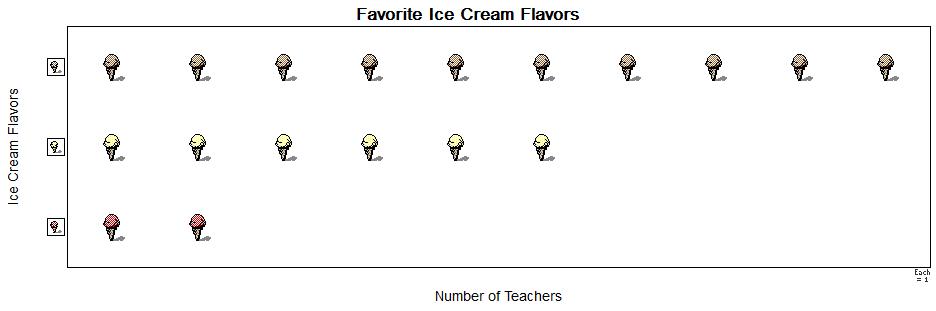
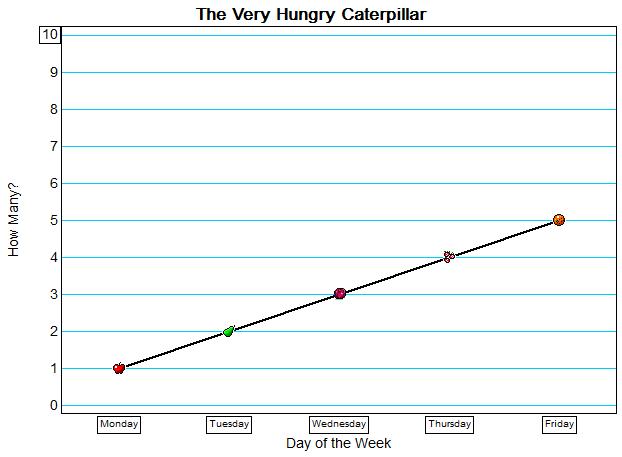
Which was the favorite flavor? If you said chocolate, you're right! I know you've graphed before in class, but I'm going to teach you about an app I love in the technology lab called The Graph Club. BUT, before I do, I want to collect some data to make a different kind of graph, a line graph. Watch one of my favorite stories below by Eric Carle. Be sure to pay attention to what the caterpillar eats Monday through Friday.
Here's our finished graph! What can you tell about the hungry caterpillar?
Assignment:
You're going to help us find out what everyone's favorite outdoor activity is by filling out the form below. I'll share the results after spring break!
0 Comments
Leave a Reply. |
Archives
March 2021
Categories |
 RSS Feed